Documents, plus data, charts and visuals
Create engaging investor experiences in your investor portal with documents and data presented on-brand an in visually stunning ways.
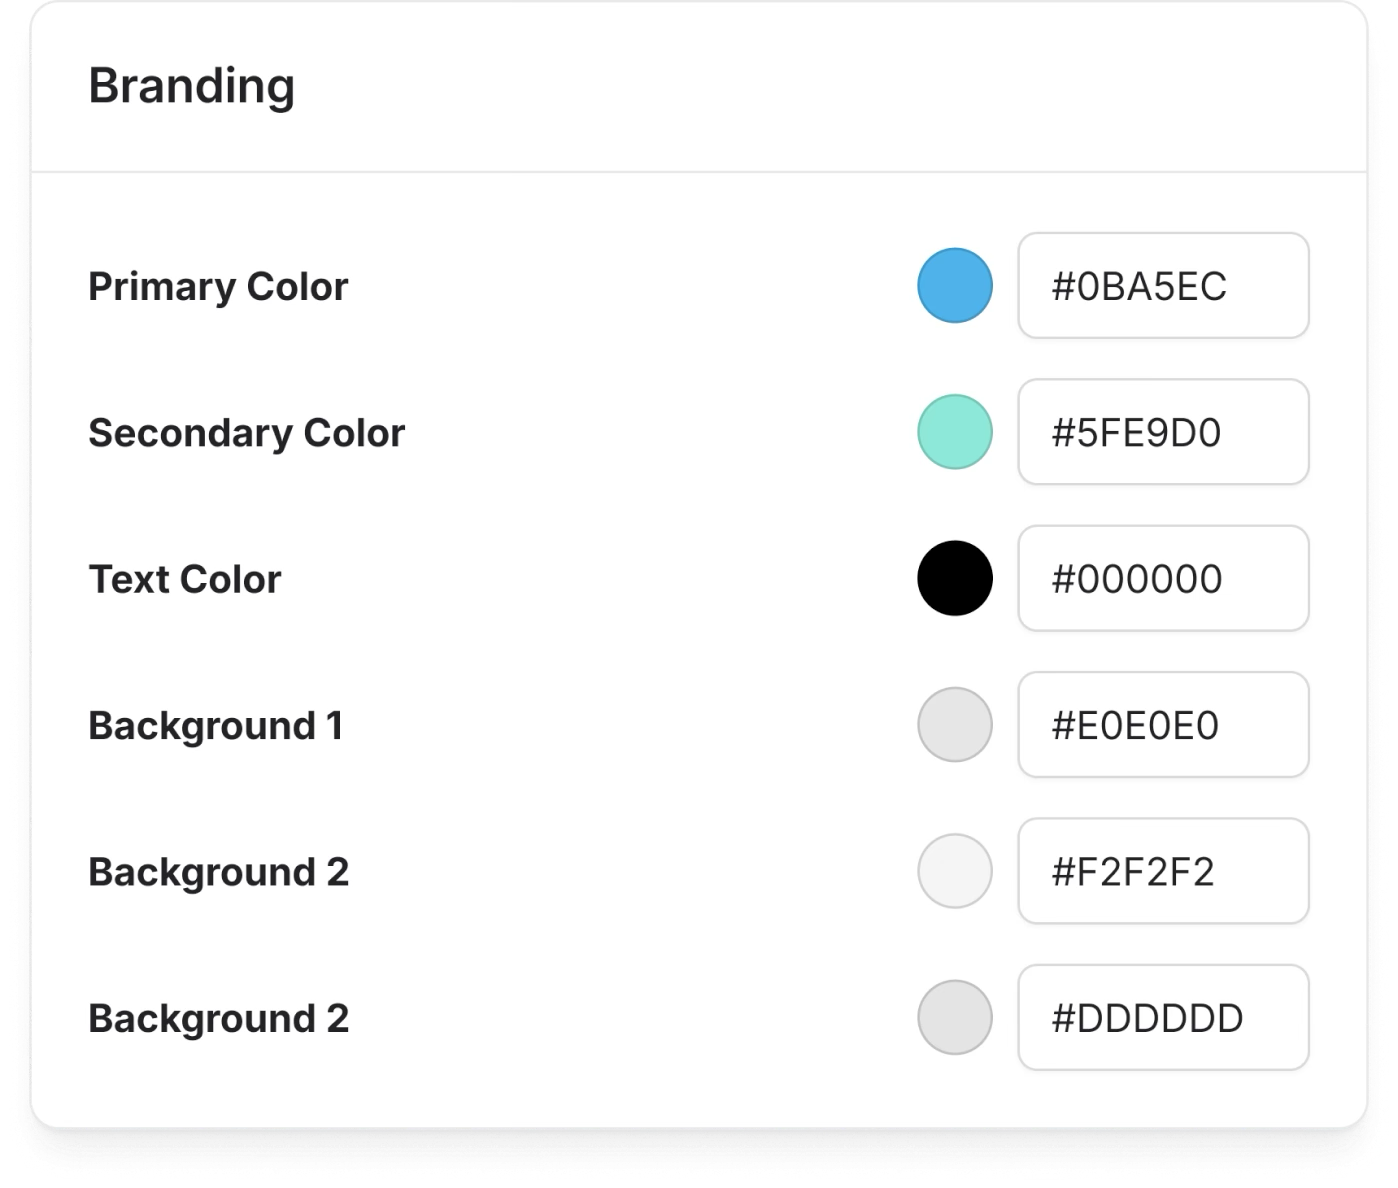
Customizable layouts and content
Build and populate dashboards using your brand colors, layouts and content, from pictures and videos to statistics, charts, tables and more.
Build and populate dashboards using your brand colors, layouts and content, from pictures and videos to statistics, charts, tables and more.
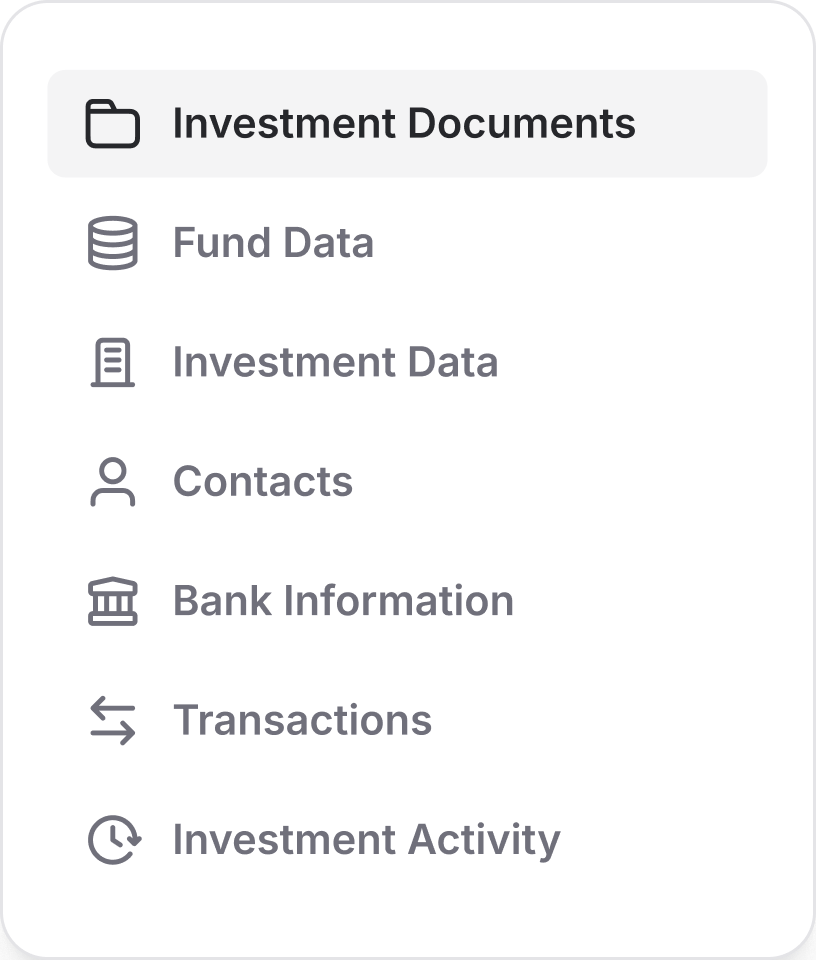
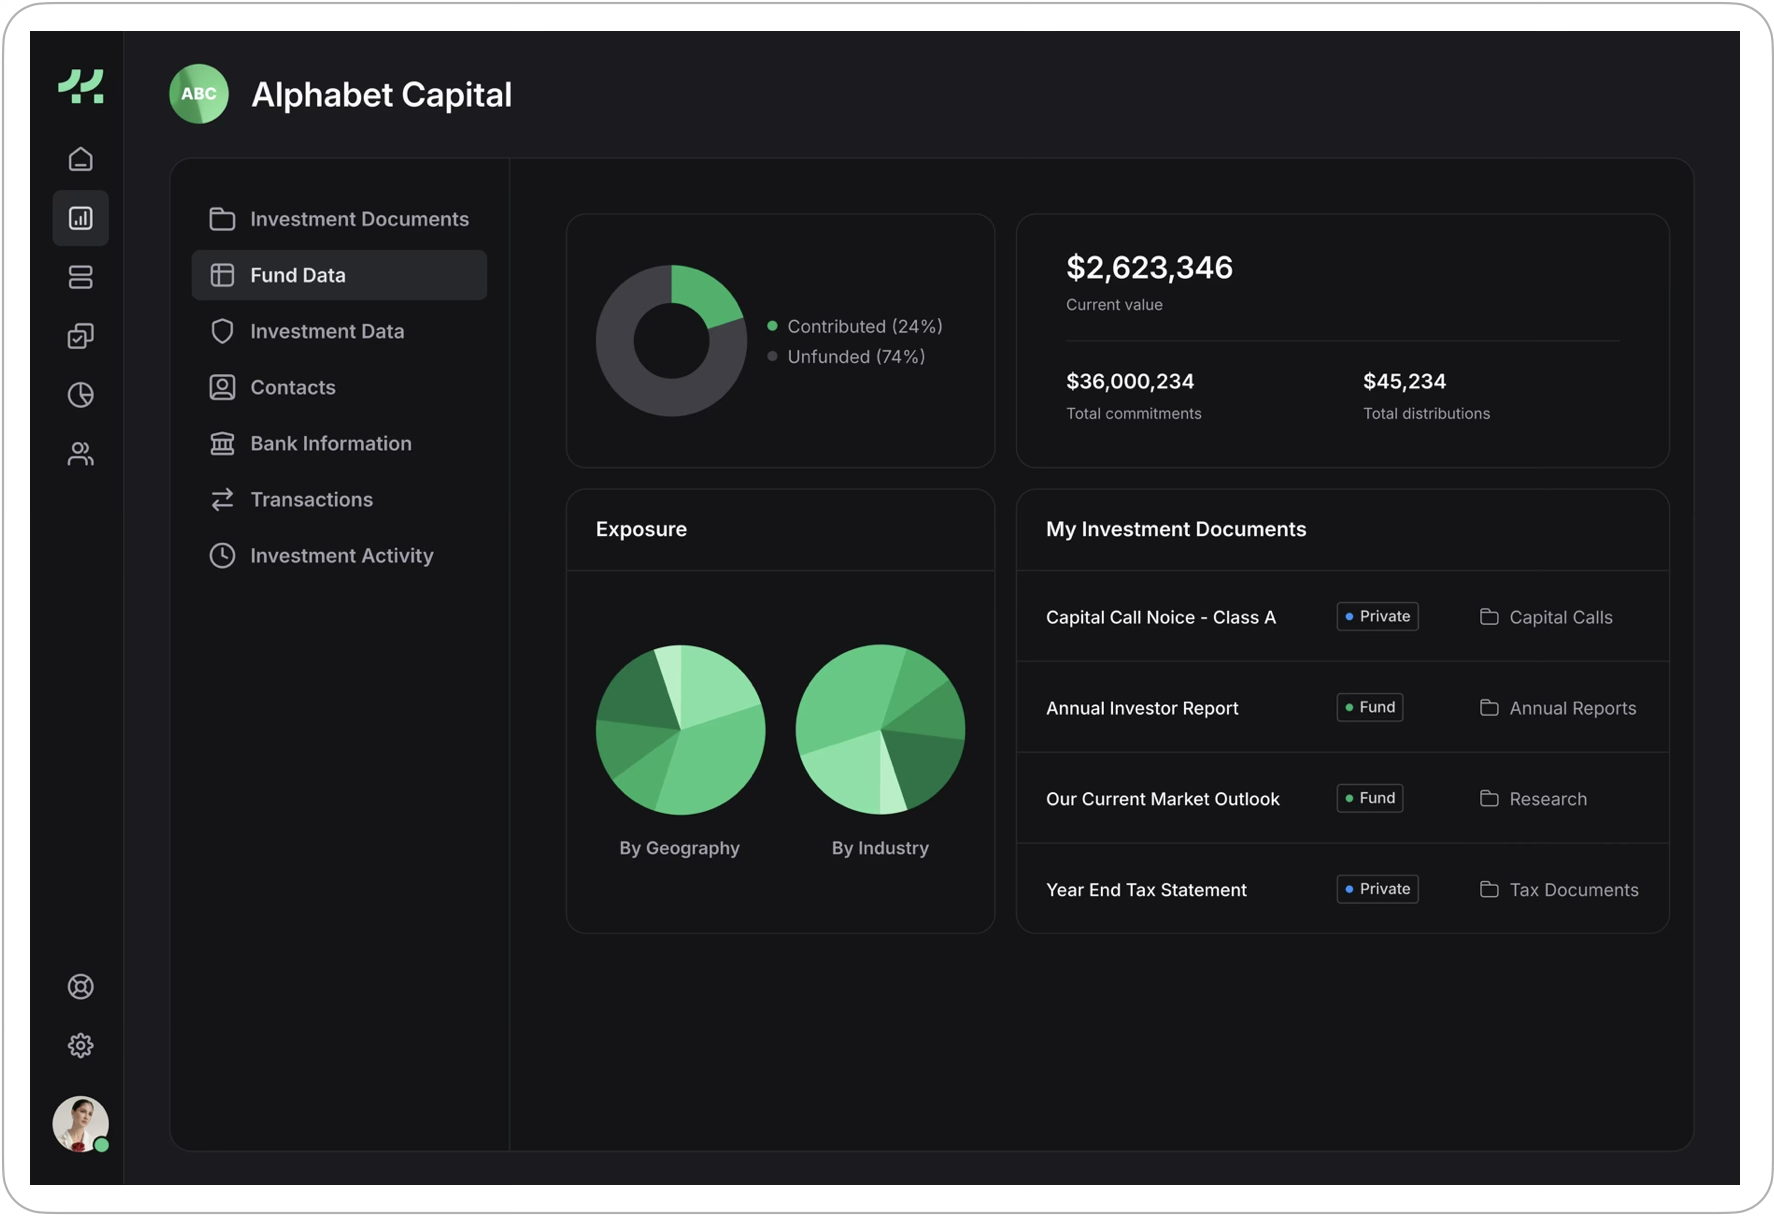
Offering- and investment-level dashboards
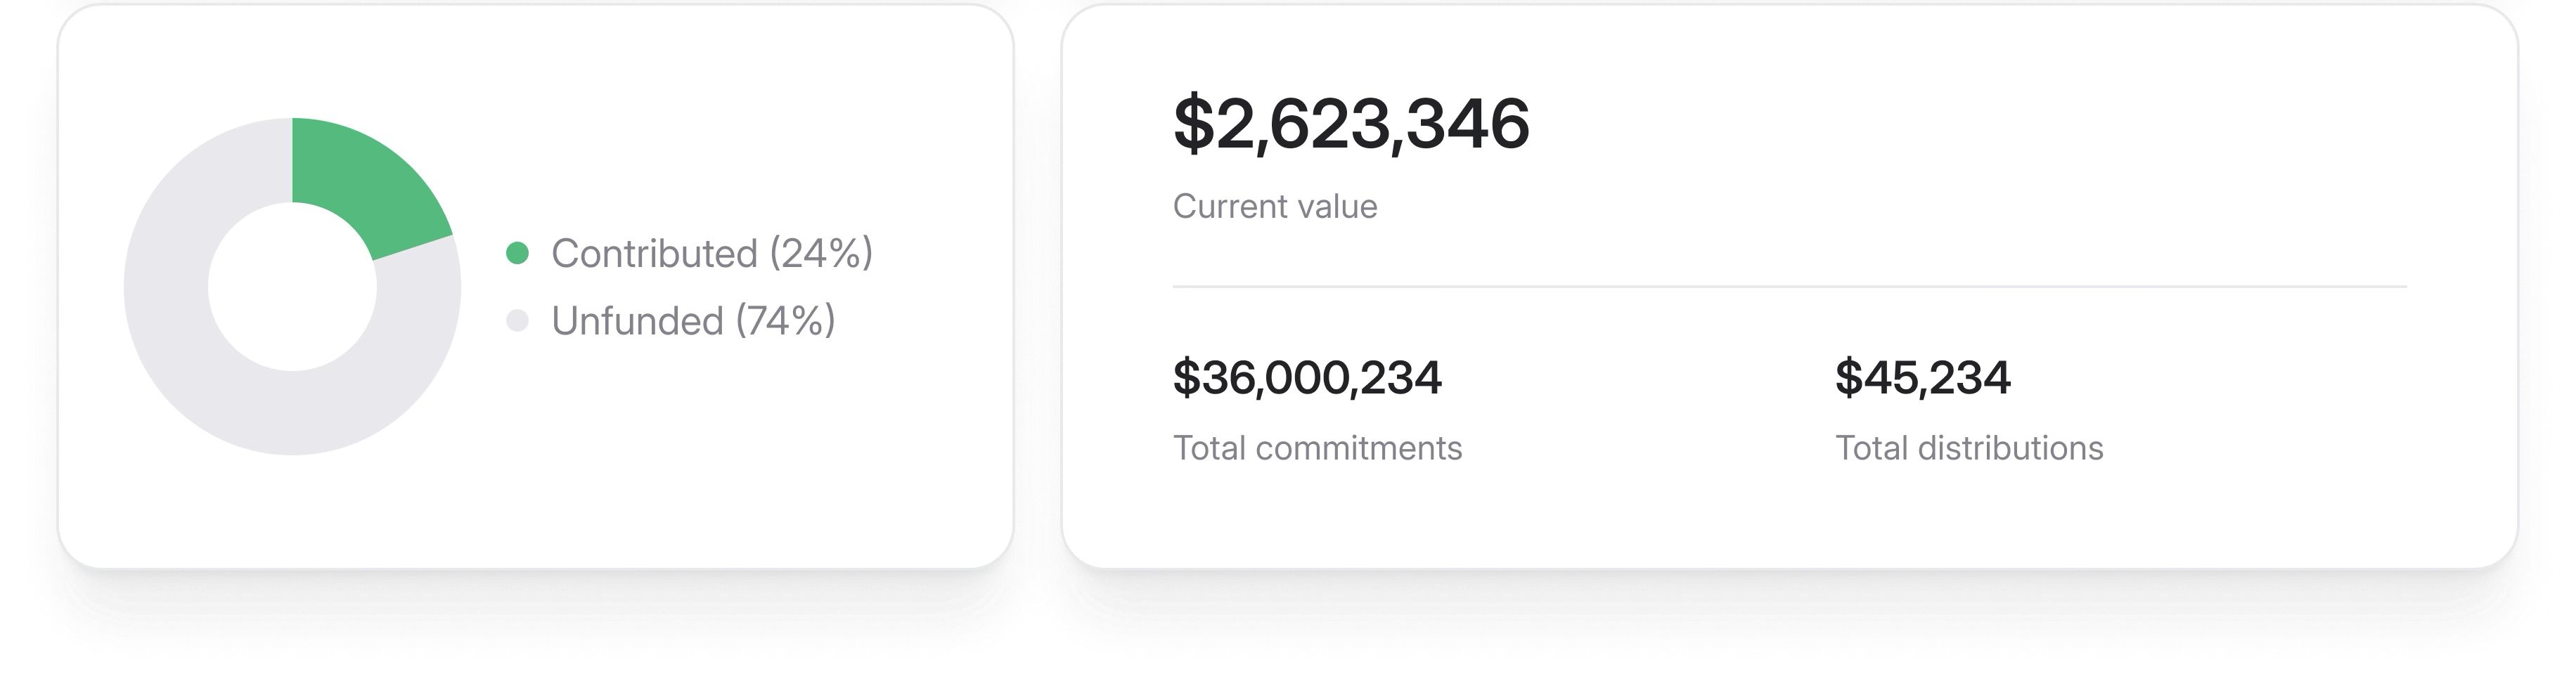
Show all investors insights at the offering level, including portfolio holdings, performance and exposures. Provide each investors specific information about their investment, such as funded and unfunded commitments, NAVs and performance metrics.
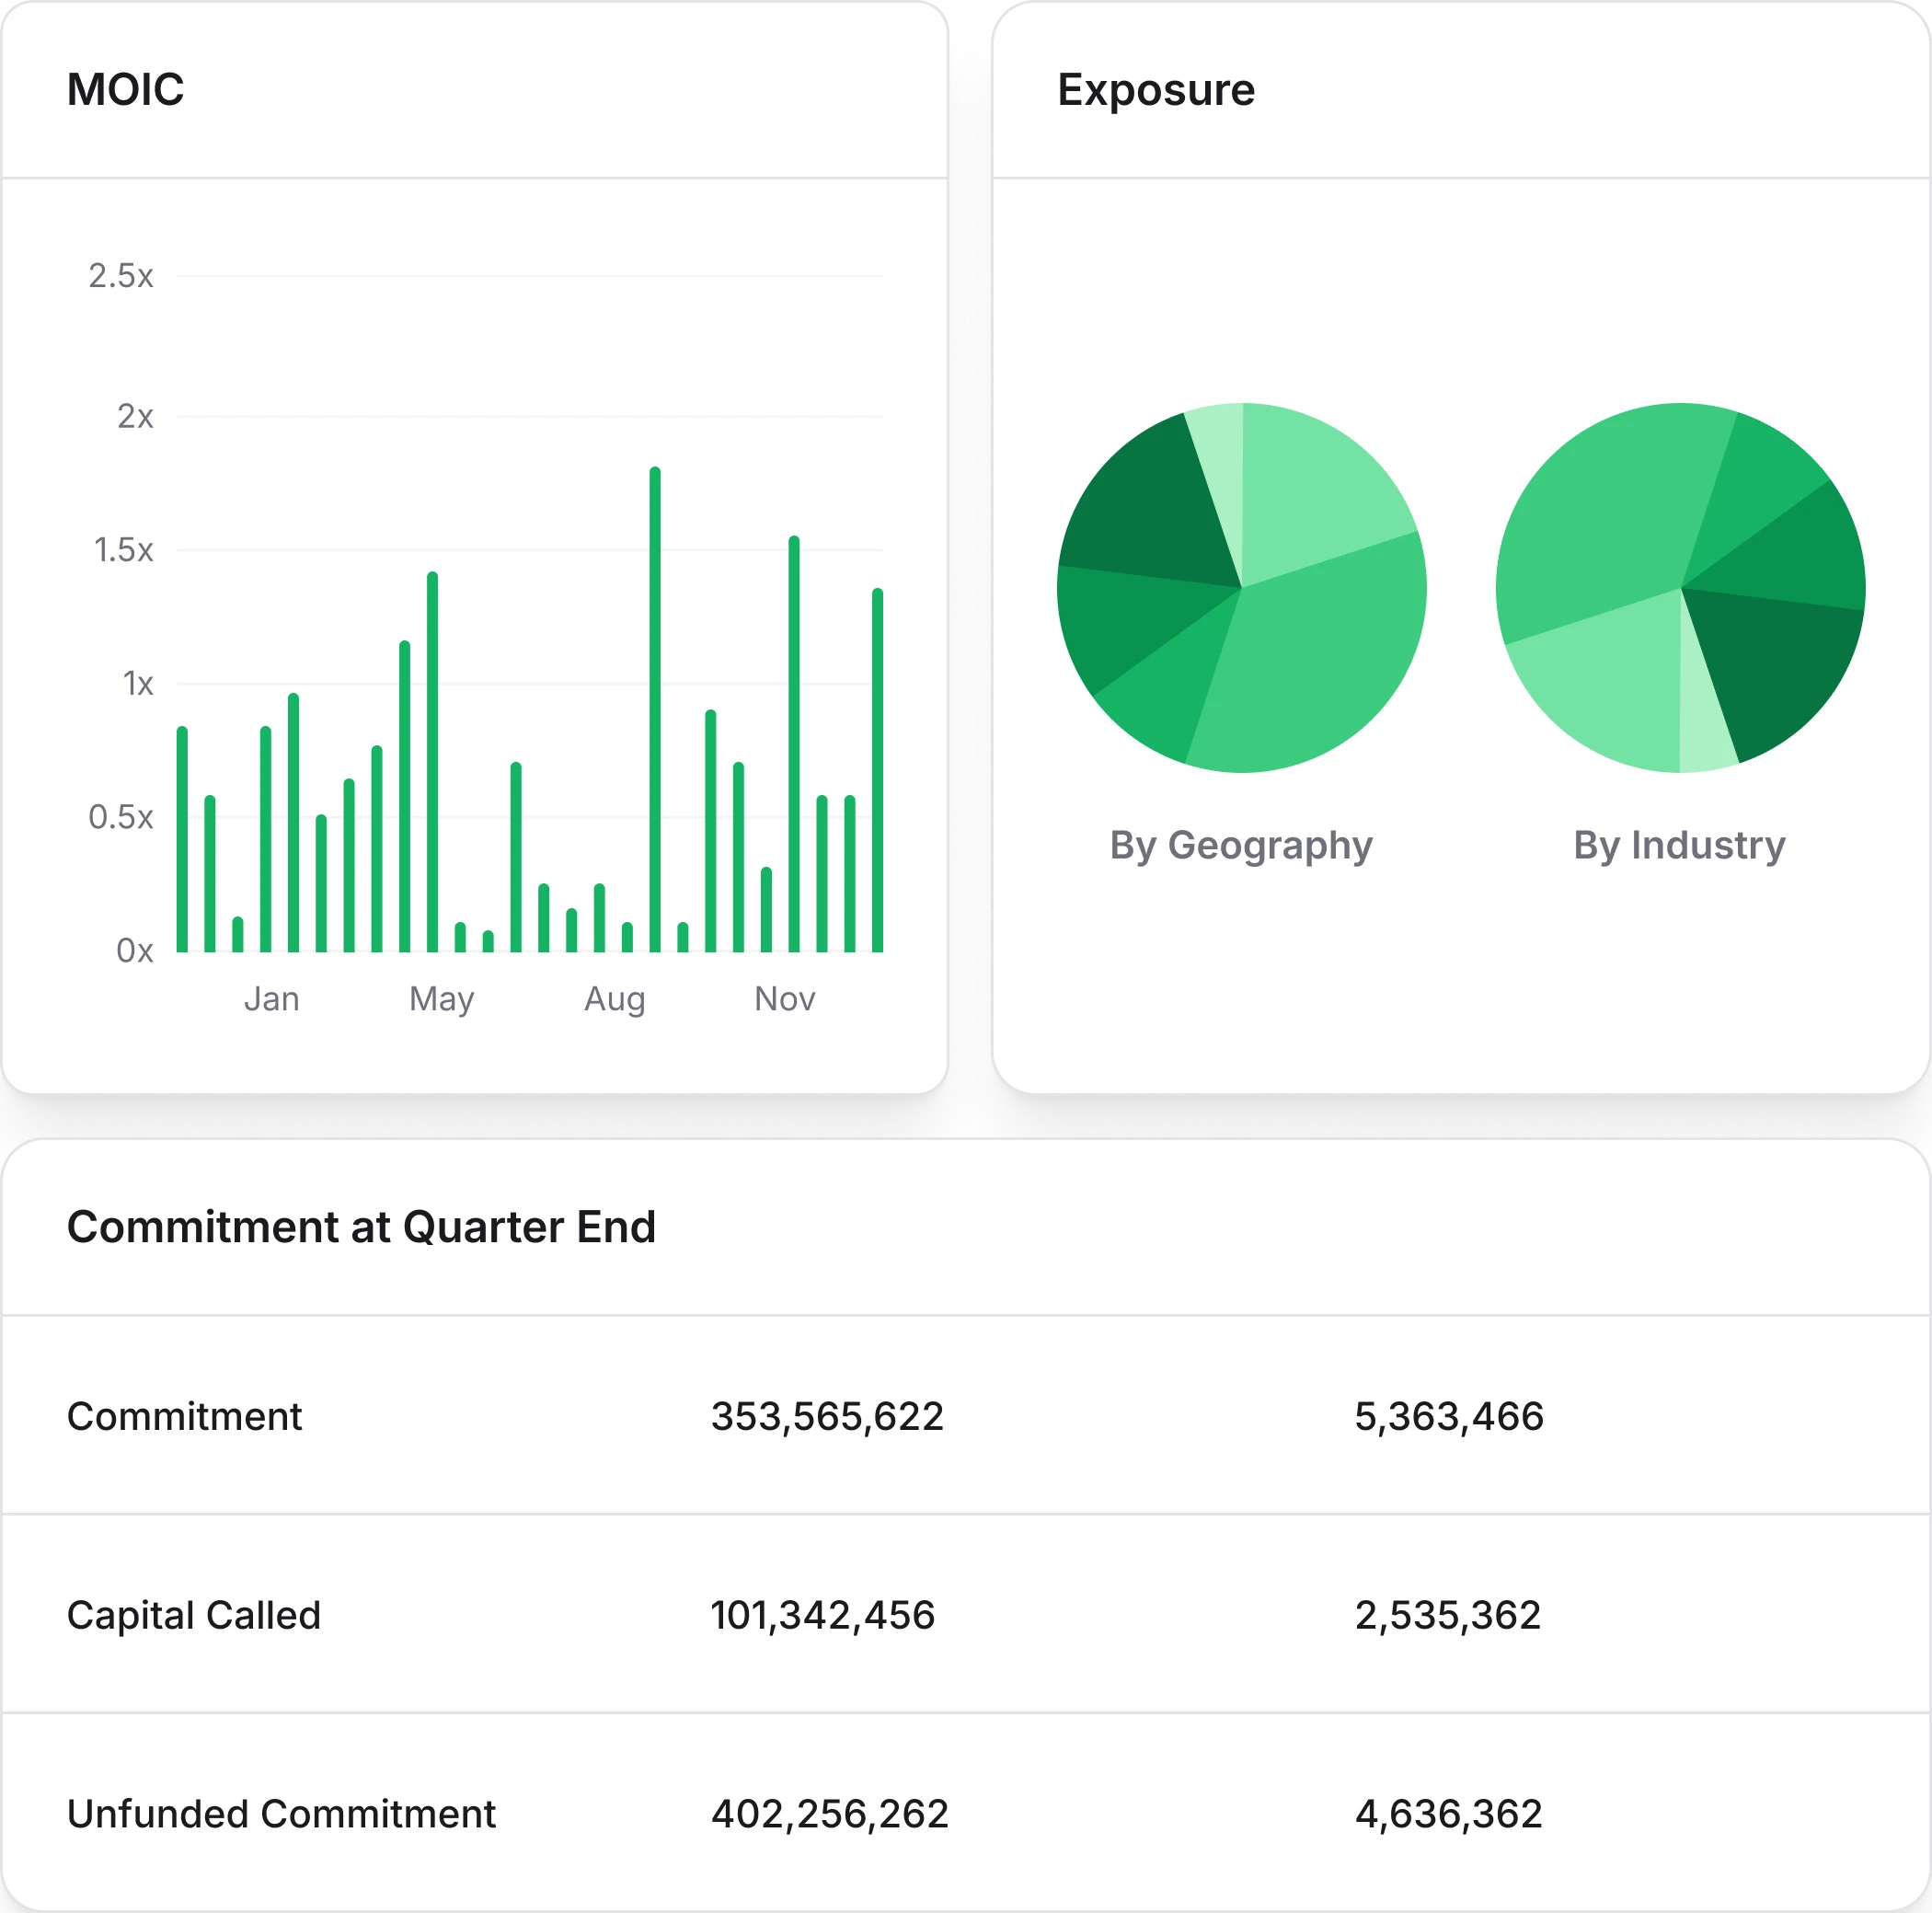
Aggregated statistics
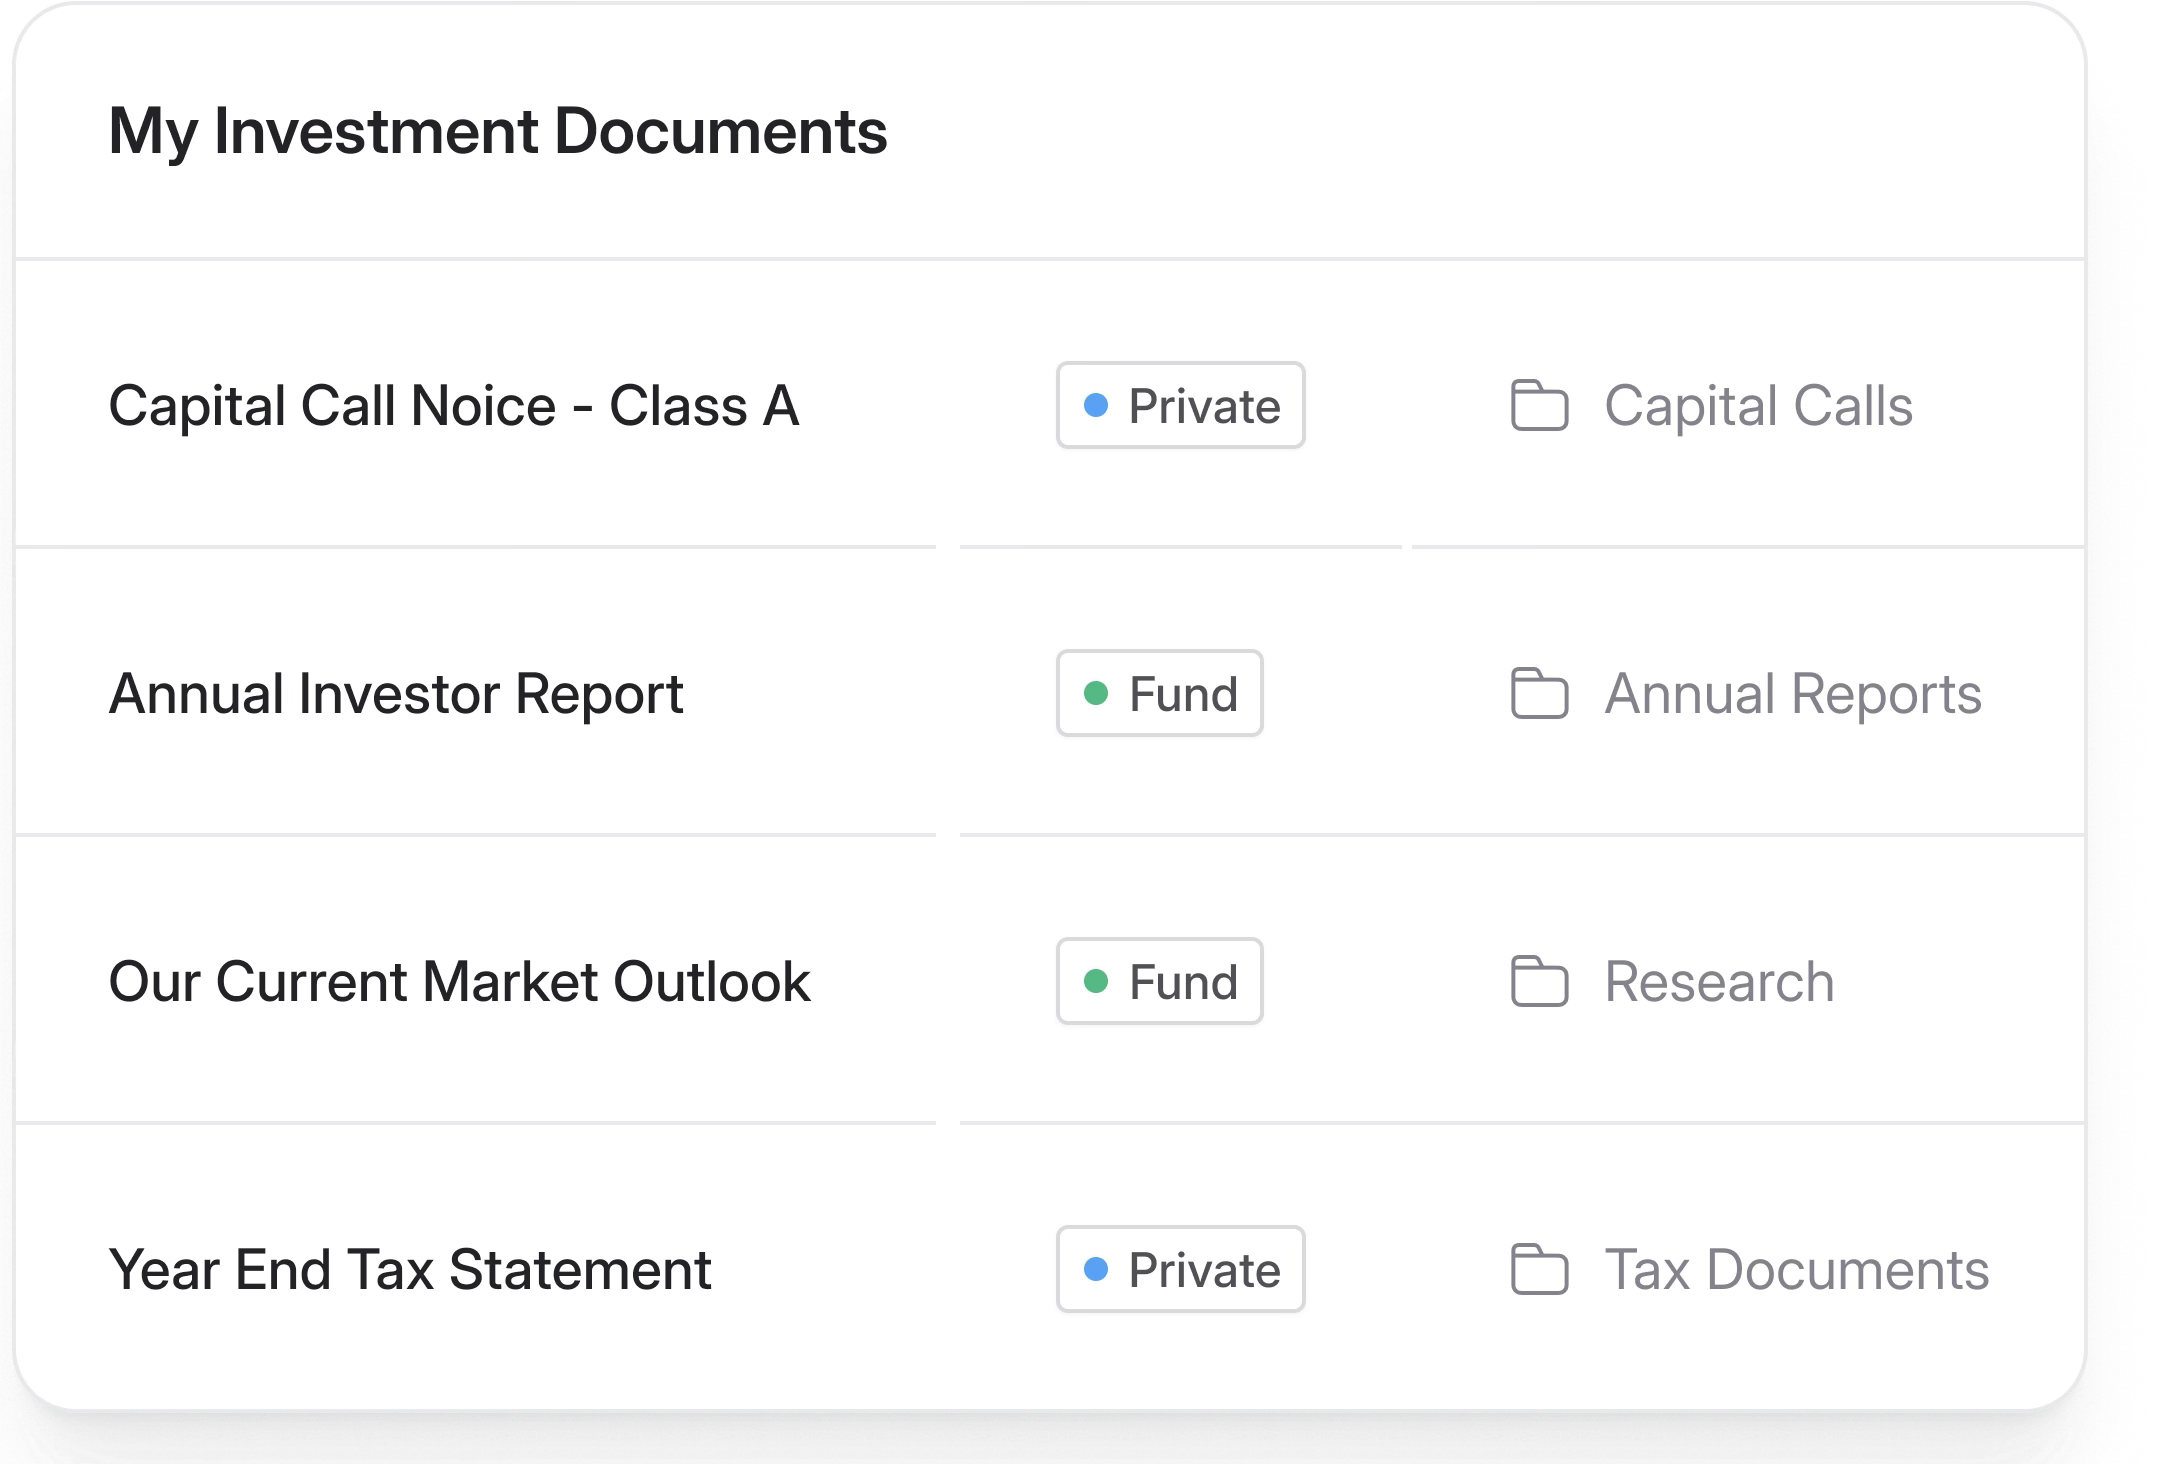
Easy document distribution
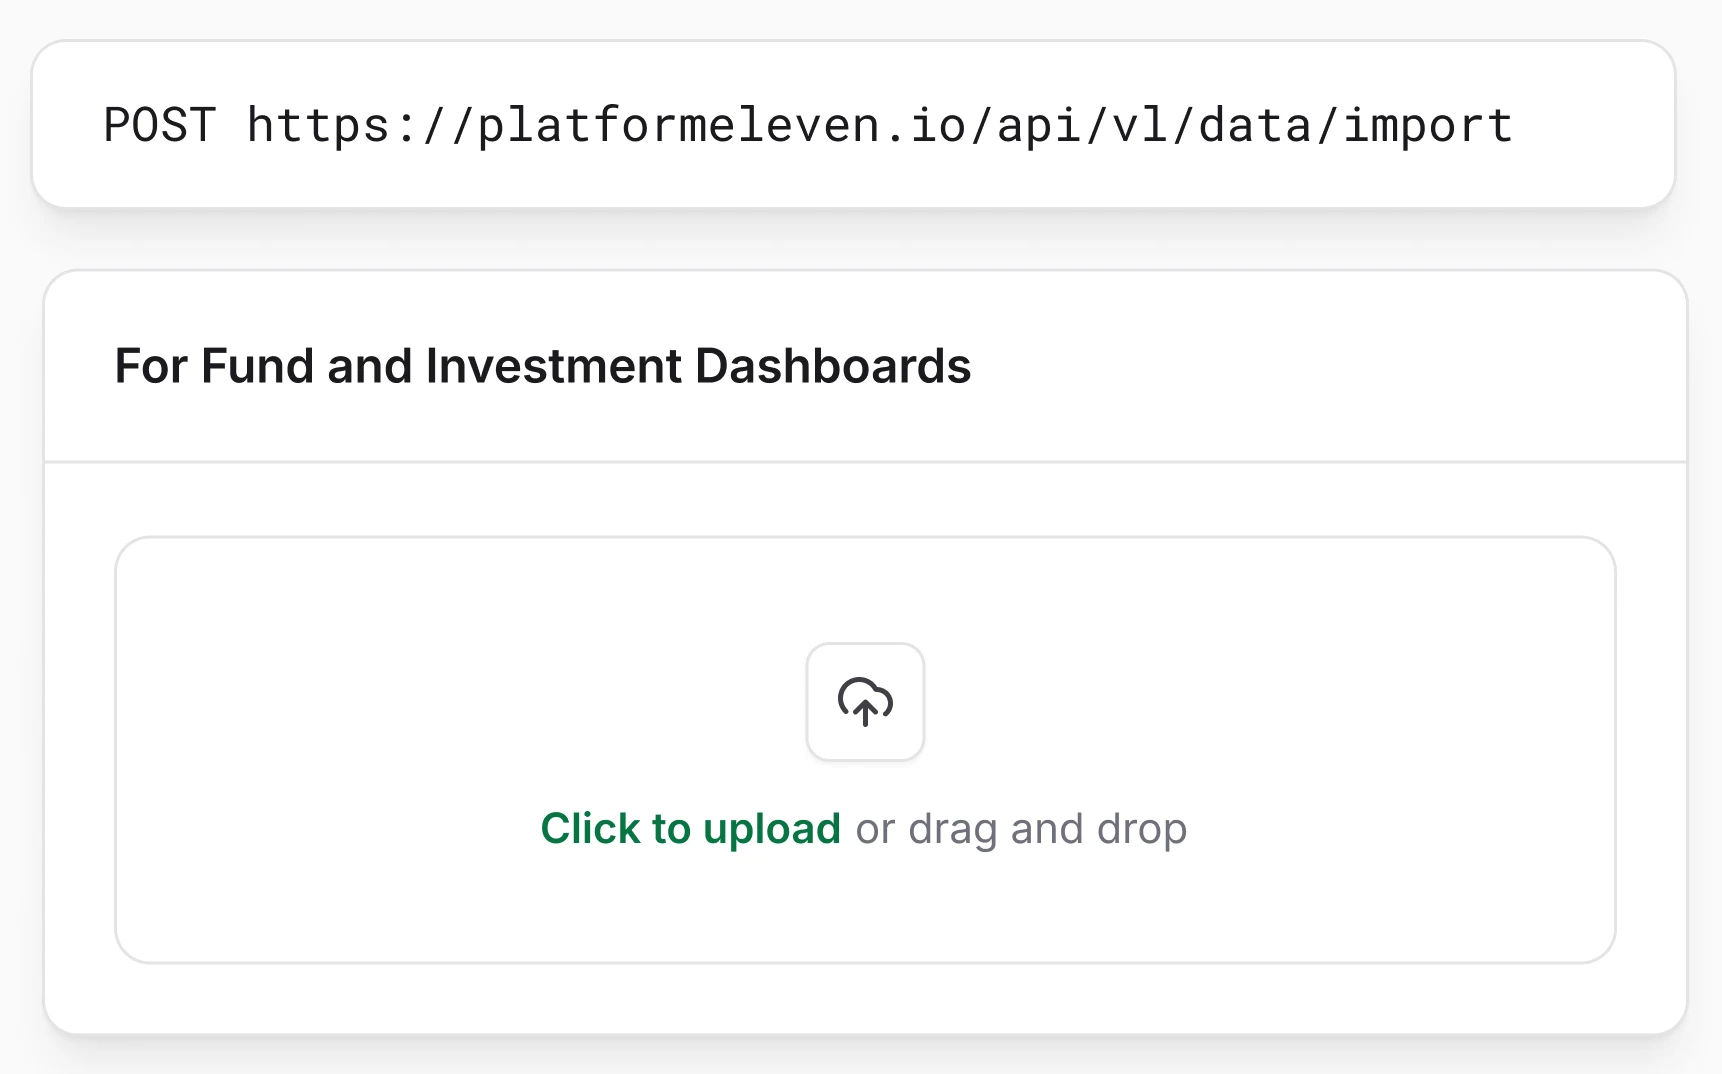
Sync data via API or upload
Connect directly to your accounting systems through APIs for real-time dashboards, or upload spreadsheets to share static and historical data.
Connect directly to your accounting systems through APIs for real-time dashboards, or upload spreadsheets to share static and historical data.
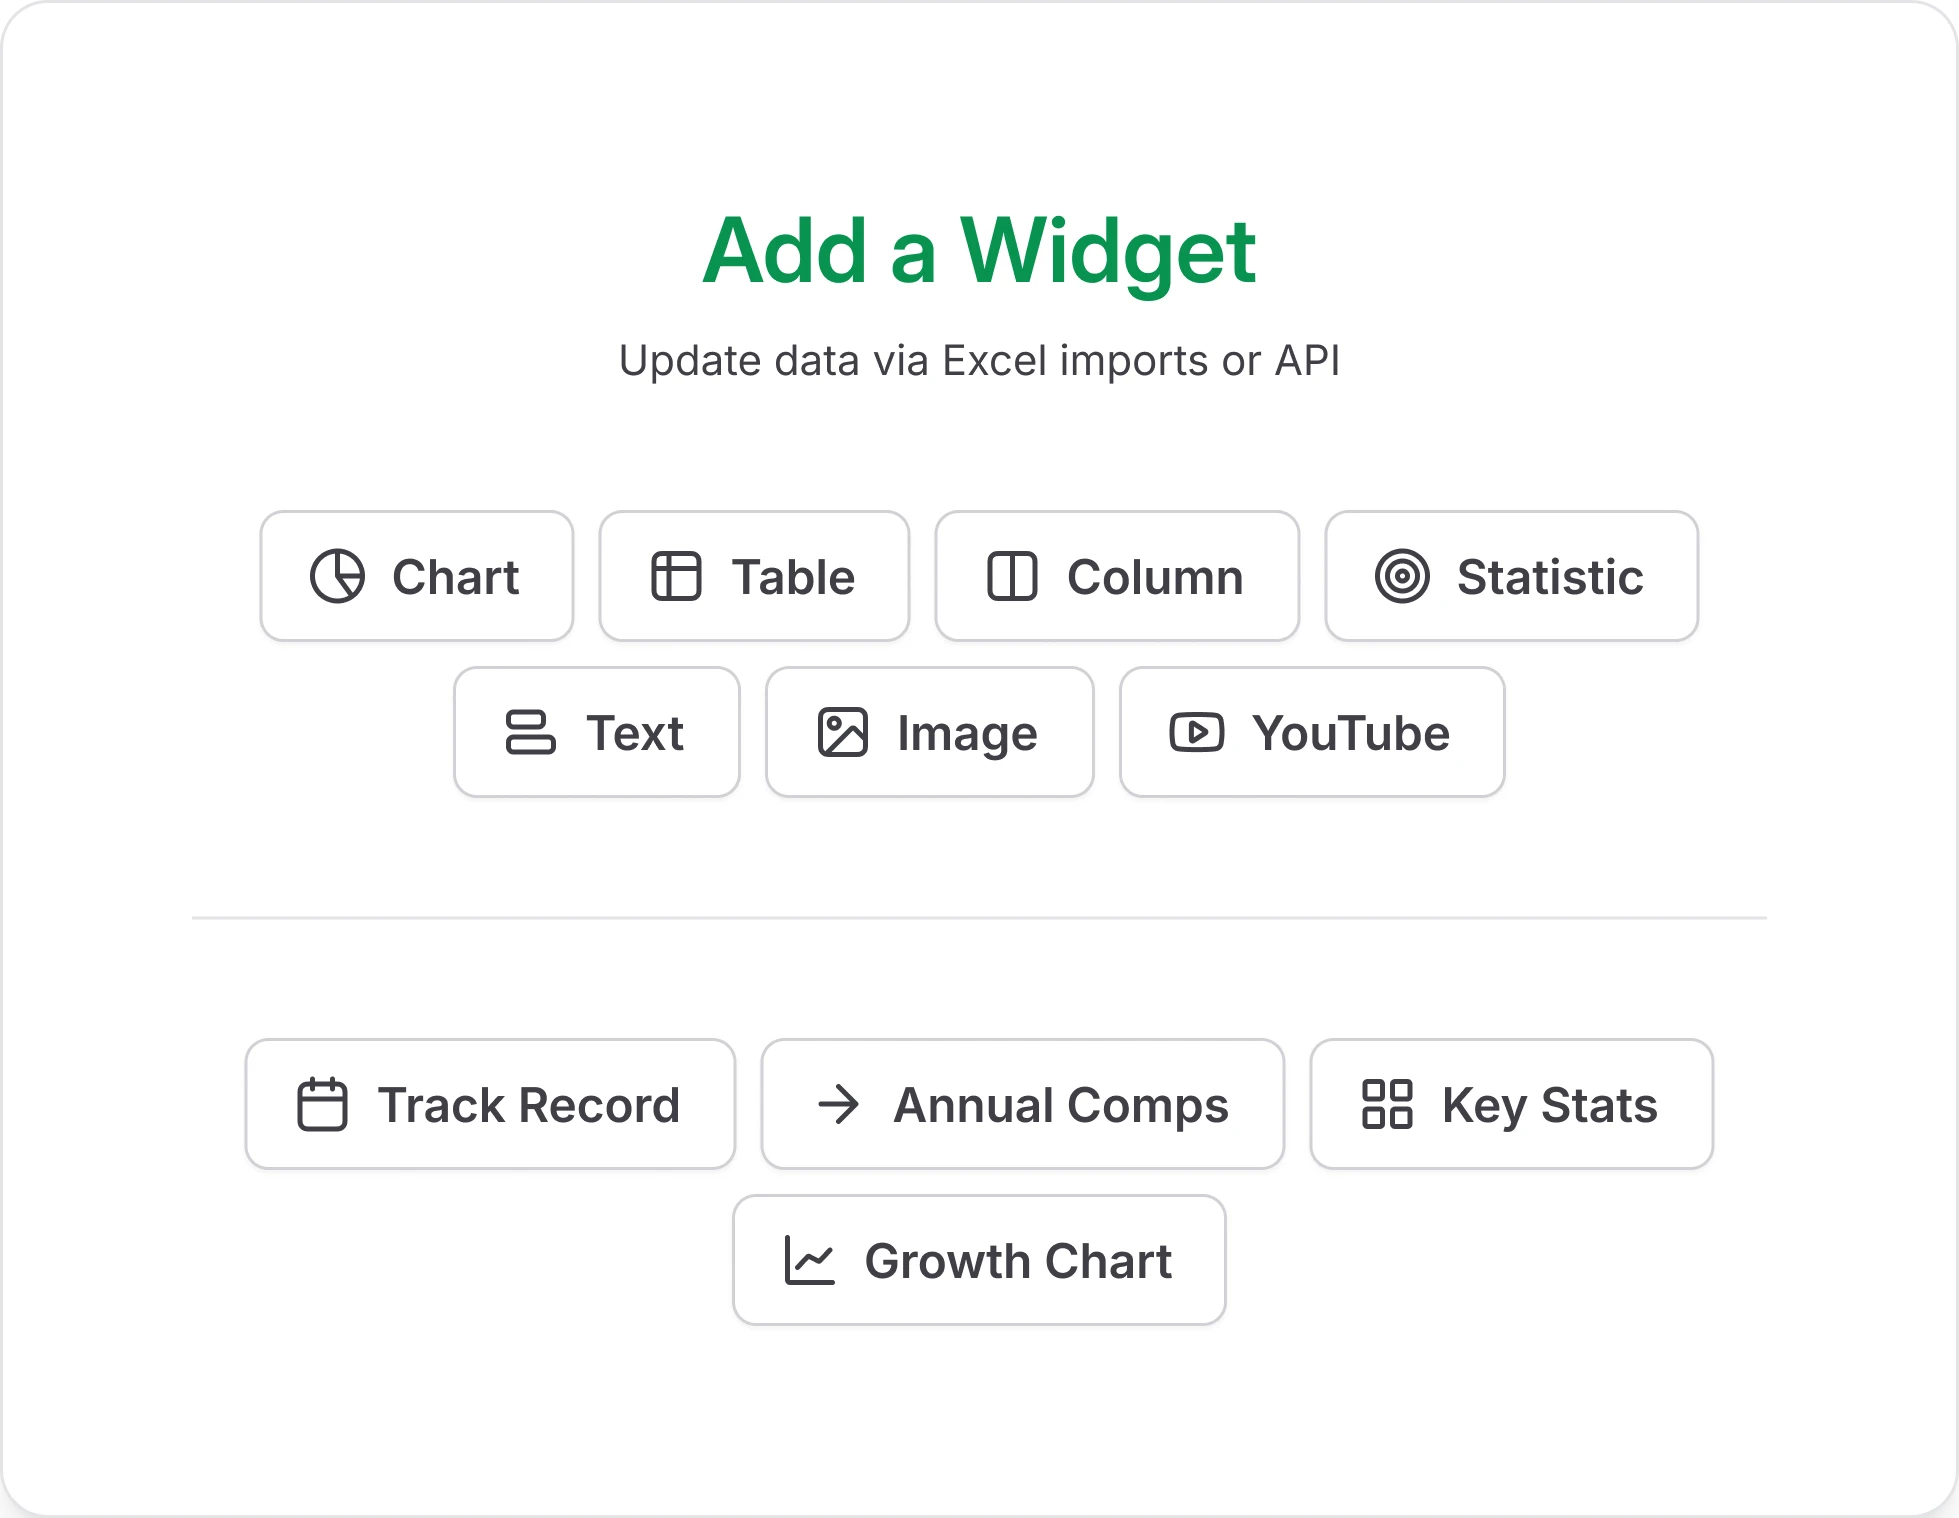
Do-it-yourself, no coding required
Use our dashboard builder to select the widgets you would like, position them on screen, connect them to data sets, and refine the designs and behavior.
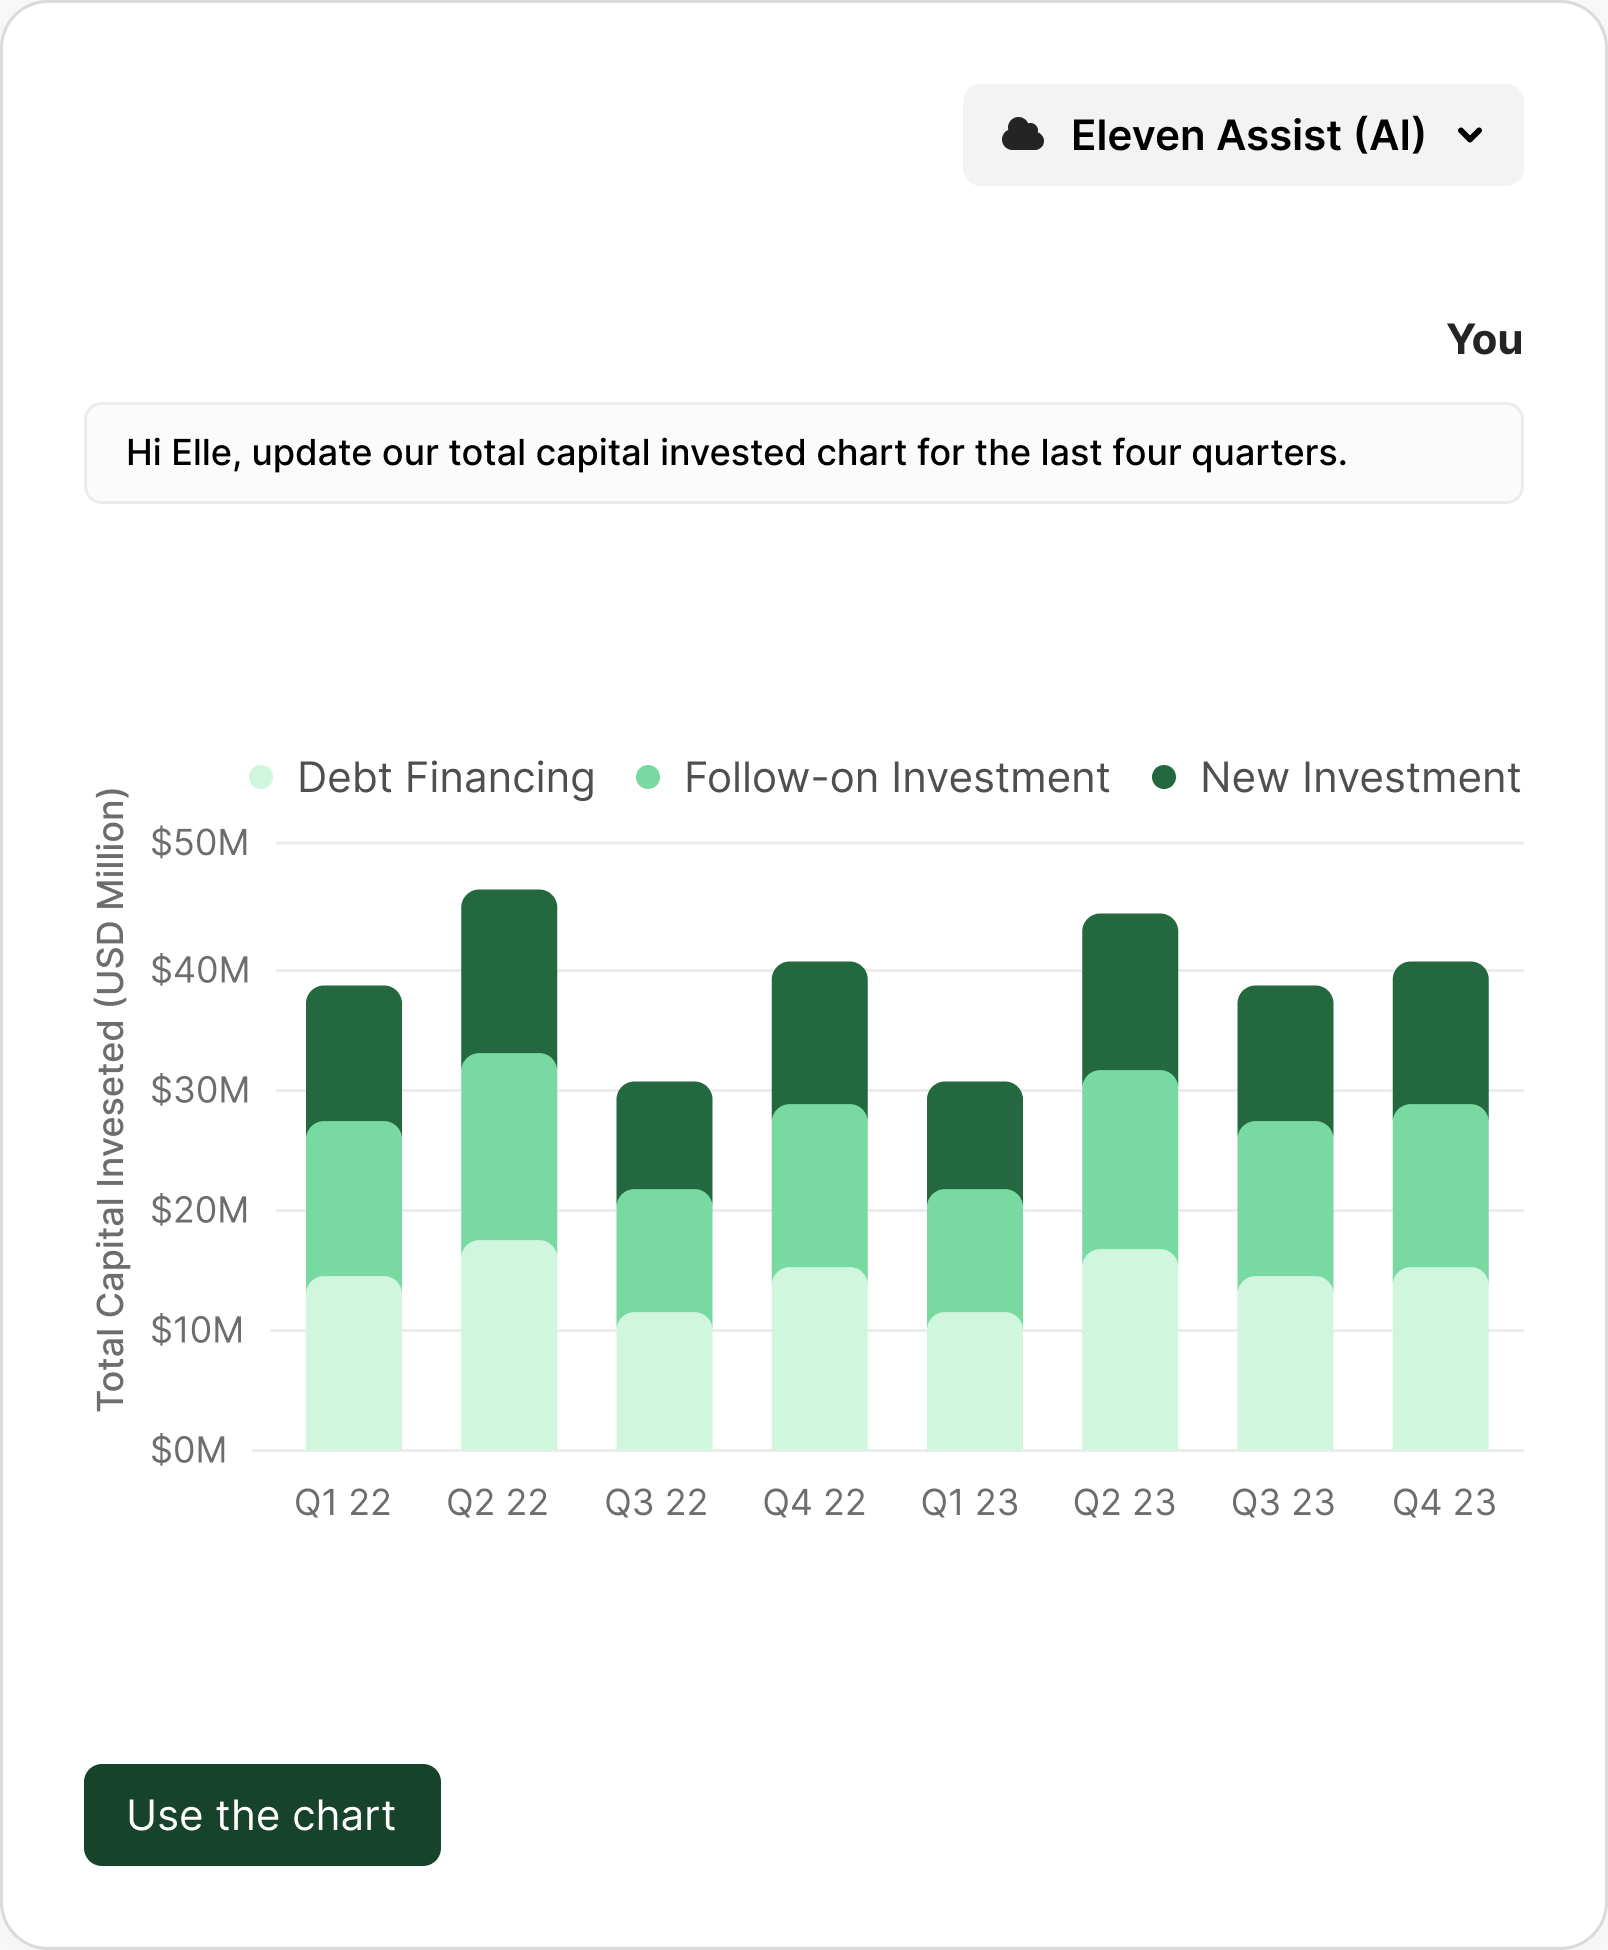
Endless charting potential using AI
Use our dashboard builder to select the widgets you would like, position them on screen, connect them to data sets, and refine the designs and behavior.
Seamless investor experience
Dashboards live directly in the Investor Portal, giving investors a continuous digital experience alongside documents, subscriptions, and communications.